A dissolved gas analysis report is not a verdict. It is a fingerprint plus a timestamp, and a DGA test on a transformer — most often on the oil-immersed power transformers that carry the distribution load — is only interpretable when you have both: which gases are present, and how fast they are changing. The same hydrogen reading of 350 ppm is unremarkable on a twenty-year-old unit that has sat there for a decade, and alarming on a new unit where it appeared in four months.
This guide walks through the reading of a real report in the order a diagnostic engineer works: gas by gas first, then condition bands, then the ratio methods, then the Duval triangle, then the cellulose question that the triangle cannot answer. It closes with the action ladder and the sampling errors that make good laboratories produce bad data.
What the test actually measures
Mineral oil decomposes when it is heated or subjected to electrical stress. The breakdown products are mostly hydrogen, methane, ethane, ethylene and acetylene, plus carbon oxides from the cellulose paper. These gases dissolve in the oil, and because the oil circulates, the concentration at the sampling valve is representative of the whole unit.
The sample is drawn into a gas-tight syringe or a sealed container per IEC 60567 or ASTM D923; what the factory performs before shipment is described in the testing and FAT guide, the site-side sequence in the commissioning checklist, and the dissolved gases are extracted and quantified by gas chromatography per ASTM D3612 or IEC 60567. The reported unit is microlitres per litre, which is parts per million by volume.
Three properties of the method are worth stating because they explain most interpretation mistakes:
- DGA detects incipient faults that no other routine test sees. A hot spot of a few hundred square millimetres produces a detectable gas signature long before it produces a temperature alarm.
- The oil concentration lags the fault. A rapidly developing fault can show a modest concentration on the day of sampling and a much larger one a week later, which is why resampling interval is a decision, not a formality.
- It says nothing about location. DGA tells you the fault type and severity, not which phase or which end of the winding. Locating the fault needs electrical tests, acoustic measurement or an internal inspection.
The seven gases and what produced them
| Gas |
Produced by |
Typical temperature range |
| Hydrogen (H₂) |
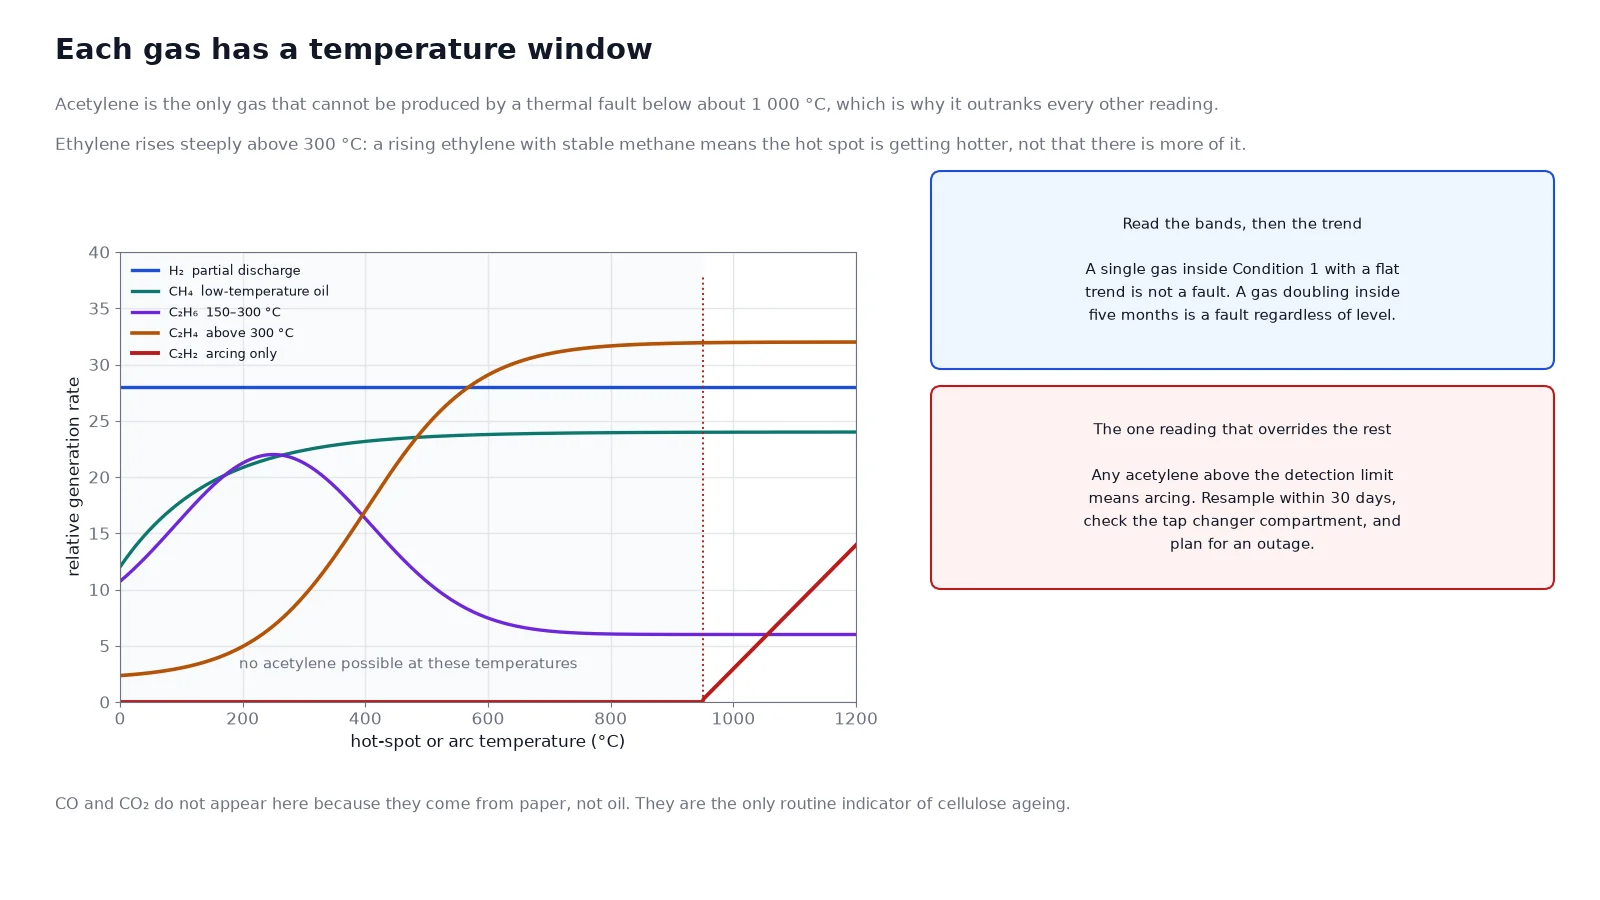
Partial discharge, corona, electrolysis, also a normal ageing product |
Ambient to low, from discharge energy |
| Methane (CH₄) |
Low-temperature oil decomposition, hot spots in a poor thermal contact |
Below about 150 °C at the metal surface |
| Ethane (C₂H₆) |
Oil decomposition at moderate temperature, early thermal fault |
150–300 °C |
| Ethylene (C₂H₄) |
The signature of a genuine hot spot; strongest indicator of thermal severity |
300 °C and above |
| Acetylene (C₂H₂) |
High-energy arcing only; not produced by any thermal fault below about 1,000 °C |
Arc discharge |
| Carbon monoxide (CO) |
Cellulose decomposition, also some oil oxidation |
Paper above about 100 °C |
| Carbon dioxide (CO₂) |
Cellulose decomposition at lower temperature than CO; the normal ageing product |
Paper ageing |
Two rules follow directly. Acetylene above the detection limit is never a thermal fault and always deserves immediate attention, whatever the other gases say. And a rising ethylene with a stable methane means a hot spot is getting hotter, not that more of the same fault is happening.
Condition bands: where the number sits
IEEE C57.104 groups the results into condition bands. The bands below are the widely used limits for mineral oil in free-breathing equipment, with the first column being the upper bound of the normal band.
| Gas |
Condition 1 upper (ppm) |
Condition 2 upper (ppm) |
Condition 3 upper (ppm) |
| Hydrogen H₂ |
100 |
700 |
1,800 |
| Methane CH₄ |
120 |
400 |
1,000 |
| Acetylene C₂H₂ |
1 |
9 |
35 |
| Ethylene C₂H₄ |
50 |
100 |
200 |
| Ethane C₂H₆ |
65 |
100 |
150 |
| Carbon monoxide CO |
350 |
570 |
1,400 |
| Carbon dioxide CO₂ |
2,500 |
4,000 |
10,000 |
| Total dissolved combustible gas |
720 |
1,920 |
4,630 |
The 2019 revision of C57.104 changed the framing of this table: it moved from a total-gas-first approach to per-gas 90th-percentile values combined with a rate-of-change assessment, and it distinguishes oil-impregnated paper systems from those with thermally upgraded paper. The numbers above remain the practical screening bands, but quote the edition your utility or insurer specifies, and do not mix values from two editions in one report.
A single gas above Condition 1 is not yet a fault. It is a reason to look at the trend and at the other gases. This is the step where reports get misread: an operator sees 130 ppm of methane against a 120 ppm limit and orders an outage, when the correct action is a resample in three months and a check of the load history.
Rate of change: the number that decides urgency
A practical rule used in condition monitoring is that any gas doubling within a known interval is a trend, not a level, and the trend is what sets the resampling interval:
- Stable at any level inside Condition 1: annual sampling is adequate.
- Rising but below Condition 2: quarterly.
- Rising into Condition 2 or showing acetylene: monthly, and plan an outage.
- Rising into Condition 3, or any acetylene increase on consecutive samples: take the unit off load and investigate.
Normalise for load where you can. A unit that spent the last quarter at 110% of rating will generate more gas than the same unit at 60%, and the trend line without the load history invites a false alarm.
Ratio methods: the second opinion
Ratios use three pairs of gases and compare them against boundary values. The IEC 60599 three-ratio scheme is the most widely used, and the Rogers ratios are its older relative. They take a minute and they are a useful cross-check before committing to the triangle.
| Ratio |
Range |
Indication |
| C₂H₂ / C₂H₄ |
< 0.1 |
No arcing; thermal or partial discharge |
| C₂H₂ / C₂H₄ |
0.1 – 3 |
Arcing present; separates low from high energy |
| CH₄ / H₂ |
< 0.1 |
Partial discharge dominant |
| CH₄ / H₂ |
> 1 |
Thermal fault dominant |
| C₂H₄ / C₂H₆ |
< 1 |
Temperature below about 300 °C |
| C₂H₄ / C₂H₆ |
1 – 3 |
300–700 °C |
| C₂H₄ / C₂H₆ |
> 3 |
Above 700 °C |
The limitation is that ratios fail when any component is near the detection limit, because the ratio then divides a small number by a smaller one. Below roughly ten times the detection limit for each gas, treat ratio output as indicative only and rely on the triangle plus the trend.
The Duval triangle
The Duval triangle plots the three hydrocarbons that carry the fault information — methane, ethylene and acetylene — as percentages of their own sum, so the point always falls somewhere inside the triangle regardless of concentration. That normalisation is why the method works on both a 50 ppm report and a 5,000 ppm report.
The procedure is four lines of arithmetic:
- Sum CH₄ + C₂H₄ + C₂H₂.
- Divide each by the sum and multiply by 100.
- Plot: %CH₄ from the bottom-left axis, %C₂H₄ from the right, %C₂H₂ from the left, following the grid lines for each.
- Read the zone, then read the concentration separately. The zone says what kind of fault; the concentration says how big it is.
| Zone |
Fault type |
Approximate position |
| PD |
Partial discharge, corona in a gas void |
Methane above about 98%, acetylene near zero |
| D1 |
Low-energy discharge, sparking, tracking |
Acetylene 4–13%, ethylene below about 23% |
| D2 |
High-energy arcing, flashover, winding short |
Acetylene above 13% |
| T1 |
Thermal fault below 300 °C |
Ethylene below 20%, methane above 80% |
| T2 |
Thermal fault 300–700 °C |
Ethylene 20–50% |
| T3 |
Thermal fault above 700 °C |
Ethylene above 50%, acetylene below 15% |
| DT |
Mixed thermal and discharge |
Acetylene 4–13% with ethylene above 23% |
For oil-impregnated paper systems there is an additional high-temperature zone, sometimes labelled T3-H, that separates a very hot thermal fault involving paper from the oil-only T3 case. That distinction matters because a paper hot spot is a life-limiting event rather than a maintenance item.
A worked example
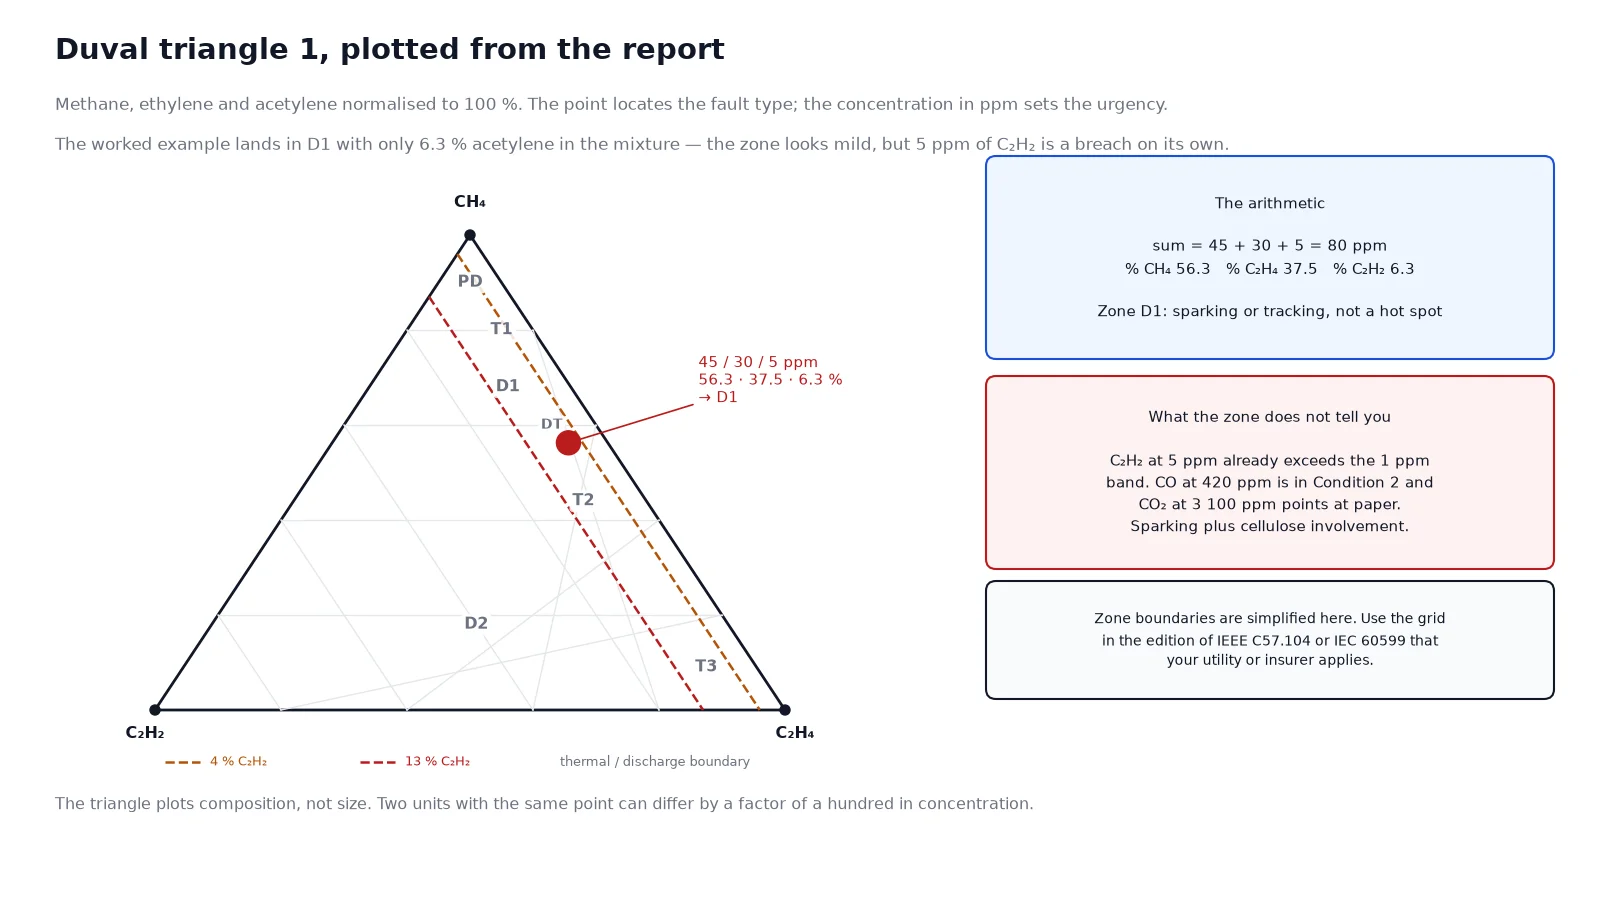
A 1,000 kVA distribution transformer returns the following: CH₄ = 45 ppm, C₂H₄ = 30 ppm, C₂H₂ = 5 ppm, H₂ = 80 ppm, C₂H₆ = 12 ppm, CO = 420 ppm, CO₂ = 3,100 ppm.
Step 1 — condition bands. Hydrogen at 80 ppm is inside Condition 1. Methane at 45 ppm is inside Condition 1. Ethylene at 30 ppm is inside Condition 1. Carbon monoxide at 420 ppm is through Condition 1 and into Condition 2. Total dissolved combustible gas is 592 ppm, inside Condition 1. So the only flag from the bands is CO.
Step 2 — acetylene check. 5 ppm is above the 1 ppm band limit. This is the finding that outranks everything else, and the zone determination does not soften it.
Step 3 — triangle. Sum = 45 + 30 + 5 = 80 ppm. So %CH₄ = 56.3, %C₂H₄ = 37.5, %C₂H₂ = 6.3. That point falls in the D1 zone — low-energy discharge, sparking or tracking, with the high ethylene ruling out a pure thermal origin.
Step 4 — ratios as a cross-check. C₂H₂/C₂H₄ = 5/30 = 0.17, which indicates arcing present. CH₄/H₂ = 45/80 = 0.56, which is ambiguous. C₂H₄/C₂H₆ = 30/12 = 2.5, which indicates 300–700 °C. The ratios agree with the triangle: a discharge with a thermal component.
The conclusion that the report alone would have missed. A D1 zone alone reads as routine sparking. But 5 ppm of acetylene on a sealed or free-breathing distribution unit is a threshold breach, and CO has moved into Condition 2 with CO₂ at 3,100 ppm. That combination — sparking plus cellulose involvement — points to a discharge that is tracking across paper, and the action is a resample in 30 days at most, an infrared scan, and an outage plan. The triangle told you the fault type; the concentration told you the urgency.
Cellulose: the part the triangle cannot see
Carbon monoxide and carbon dioxide come from paper, not oil, and they are the only routine indicators of solid insulation ageing. Absolute values are weak evidence on their own because CO and CO₂ accumulate over a thirty-year life. The ratios are more useful:
- CO₂/CO ratio in the range of about 3 to 10 is consistent with normal ageing. A ratio below 3 suggests a hot spot involving paper rather than oil, because high temperature favours CO over CO₂.
- CO/CO₂ ratio above about 0.33 is sometimes cited as a paper-degradation flag, and it should always be read together with the furan result rather than alone.
- Furans, particularly 2-furfural, are direct cellulose decomposition products. They correlate with degree of polymerisation, and one commonly used relation gives DP from the 2-FAL concentration: DP = (1.51 − log₁₀(2-FAL in ppm)) / 0.0035. At 1 ppm of 2-FAL the estimate is a DP of about 430, which is end-of-life territory; at 0.1 ppm it is about 520, which is aged but serviceable.
Treat a DP estimate as a trend indicator rather than a measurement, because the correlation varies with paper type and oil chemistry. Its value is in the comparison with the previous sample.
The action ladder
| Result |
Action |
Timeline |
| All gases in Condition 1, no acetylene |
Continue annual sampling; record the baseline |
12 months |
| One gas in Condition 2, stable trend |
Resample, review load history, infrared scan |
3 months |
| Any acetylene above detection limit |
Resample, investigate the tap changer and any arcing path, plan an outage |
30 days or sooner |
| Gas in Condition 3, or doubling within the interval |
Off-load, DGA at short interval, prepare for internal inspection |
Immediate |
| CO₂/CO below 3 with rising CO and furans present |
Treat as paper hot spot; derate and plan replacement or refurbishment |
Immediate planning |
The settings that turn a gas reading into an outage decision are covered in the protection coordination guide. One further check belongs in the ladder because it is cheap and often decisive: confirm that the tap changer compartment is not sharing oil with the main tank. A diverter switch that arcs on every operation produces acetylene continuously, and a DGA report showing acetylene with no other fault evidence on an on-load tap changer unit is often exactly that. On units where the compartments are separate, sample both.
Sampling errors that ruin the data
Bad data is worse than no data, because it produces confident wrong decisions. The five recurring errors:
- No flush. The first two to three litres from the valve contain stagnant oil and contamination from the valve seat. Draw and discard, then take the sample.
- Air ingress. A syringe with a bubble has lost the light gases to the bubble. Hydrogen and methane are the first to go, so the report reads artificially low on exactly the gases that indicate partial discharge.
- Wrong container. A plastic bottle is permeable to hydrogen. Glass syringe, or a sealed metal container rated for the purpose.
- Delay before analysis. Analyse within 72 hours where possible; transport upright, dark and at a stable temperature.
- No temperature record. Gas solubility depends on oil temperature, and a sample taken at 70 °C is not directly comparable with one taken at 15 °C without the note.
Frequently asked questions
What is a DGA test on a transformer?
Dissolved gas analysis measures the concentration of fault gases dissolved in the insulating oil — hydrogen, methane, ethane, ethylene, acetylene, carbon monoxide and carbon dioxide — by gas chromatography. Because each fault type produces a characteristic gas pattern, the result identifies the fault type and severity without opening the unit.
How often should a transformer be tested with DGA?
Annually for a unit in normal condition, which also builds the trend history. Move to quarterly once any gas enters Condition 2, monthly when acetylene appears, and immediately after any through-fault, Buchholz operation, lightning strike or overload event.
What acetylene level is dangerous?
Any acetylene above the detection limit means arcing is occurring, and above 1 ppm the unit should be resampled within weeks. Above 9 ppm the condition band is exceeded and above 35 ppm the unit should be taken off load. There is no benign level of acetylene in a transformer without an on-load tap changer.
Can DGA tell me where the fault is?
No. DGA identifies the fault type — partial discharge, sparking, arcing, or a hot spot at a given temperature — but not the phase or the axial position. Locating the fault needs a sweep frequency response test, an internal acoustic survey or a visual inspection during an outage.
What does a high CO/CO₂ ratio mean?
It suggests that the cellulose paper is being degraded at a temperature high enough to favour carbon monoxide over carbon dioxide, rather than ageing normally. Read it with the furan result and with the trend in CO; an isolated ratio in the normal 3 to 10 band is not a finding.
Does DGA work on ester-filled transformers?
The method works but the limits do not transfer. Natural and synthetic esters generate different gas patterns under the same fault, and the mineral-oil bands of IEEE C57.104 or IEC 60599 will over- or under-state severity. Use the limits published for the specific fluid, and tell the laboratory which fluid is in the unit when the sample is submitted.
The takeaway
Read a DGA report in four passes: the individual gases against the condition bands, the acetylene line on its own, the Duval triangle for fault type, and the trend for urgency. Then check the paper indicators, because a fault that involves cellulose is a life-limiting event rather than a maintenance item. The single most common error is stopping at step one.
If you are specifying oil-immersed units and want the DGA baseline and oil test certificates supplied with the factory report, the oil-immersed transformer specification and cost guide explains what is included, and the 35 kV selection guide covers the larger ratings where a permanent online DGA monitor is usually justified. Units built by a oil-immersed distribution transformer manufacturer with a documented factory DGA baseline are far easier to diagnose in service, and the same logic applies to discharge-related evidence on cast-resin units in the partial discharge guide.